Generate the Breakeven Report
Once you have reviewed the breakeven total, you can generate the Breakeven Report. [Show image.][Hide image.]
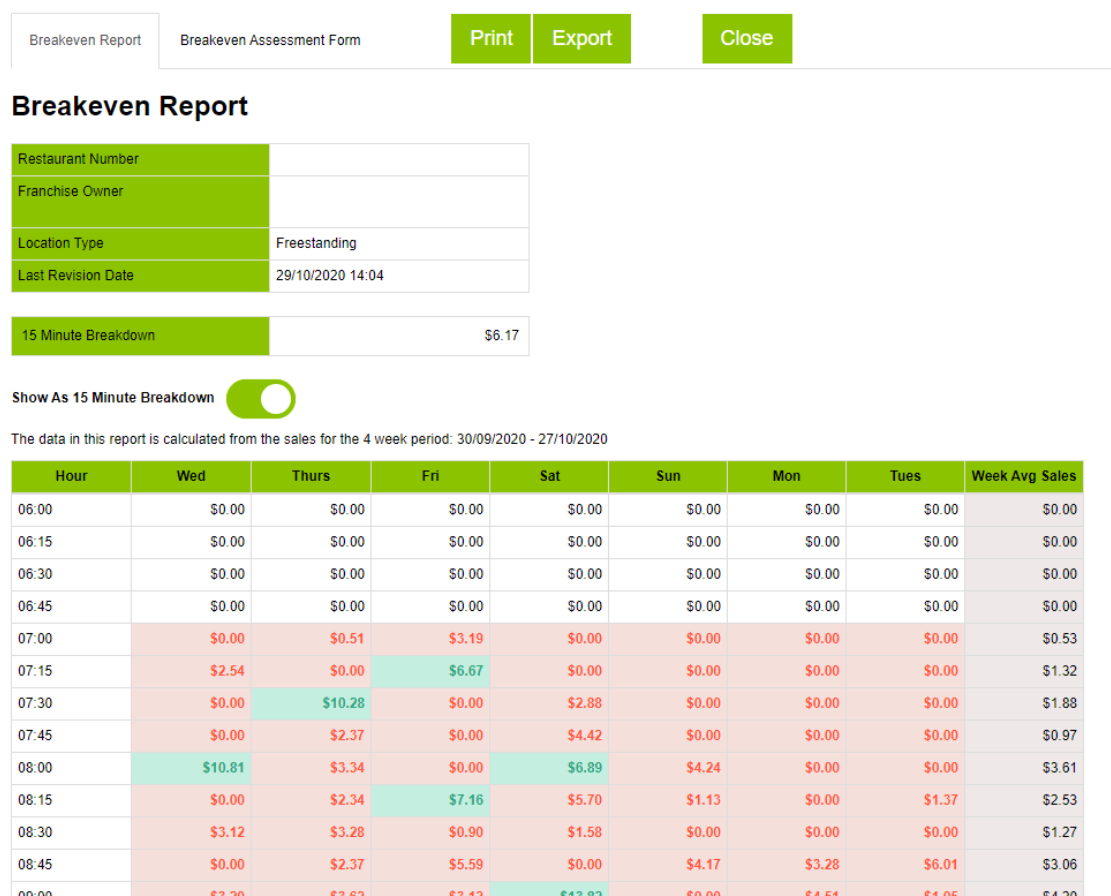
The report uses the following conventions:
-
If the restaurant is below breakeven for a specific time period, the cell is shaded red.
-
If the restaurant is equal to or above breakeven, the cell is shaded green.
-
Hours when the restaurant was closed (based on the hours of operation that you enter in the assessment form) are not shaded.
-
The daily columns display the sales broken down by hourly or 15-minute periods. You can use the Show As 15 Minute Breakdown toggler to switch between 15-minute and hourly increments in the report.
-
The hours displayed are from 7 a.m. until 6 a.m., where the 7 a.m. hour goes from 6:00 a.m. until 6:59 a.m. and the 6 a.m. hour goes from 5:00 a.m. until 5:59 a.m.
In addition, the report includes a column for the weekly average sales. Finally, some recommendations appear below the table of values to help you address any issues identified in the assessment.
Generate and Review the Report
-
Once you have entered all the data into the Breakeven Assessment Form and reviewed the breakeven values, click Run.
-
Click the Show As 15 Minute Breakdown toggler to switch between 15-minute and hourly increments.
-
To print the report, click Print, use the Print dialog box to specify the print options, and click Print.
-
To export the report as an Excel file, click Export.
Once the Excel file is downloaded, you can open it in Excel. The file contains the same data and color-coding that appears on the Breakeven Report in LiveIQ.